ADB Debugging
ADB (Android Debug Bridge) is a command-line tool officially provided by Android for debugging and managing Android devices.
Our tutorial uses Android SDK Platform-Tools for ADB debugging.
Android SDK Platform-Tools is a core component of the Android Software Development Kit (SDK), providing a collection of utilities for developers and advanced users to interact with and manage Android devices and emulators.
Android SDK Platform-Tools includes tools like ADB (Android Debug Bridge), Fastboot, and supports major operating systems such as Linux, Windows, and Mac.
Prerequisites
① Ensure the Android system on your board has successfully booted; otherwise, subsequent ADB debugging will not be possible.
② Connect the board's OTG port to your computer using a USB cable
Note: The OTG port on ROCK 4D is the upper USB 3.0 Type-A port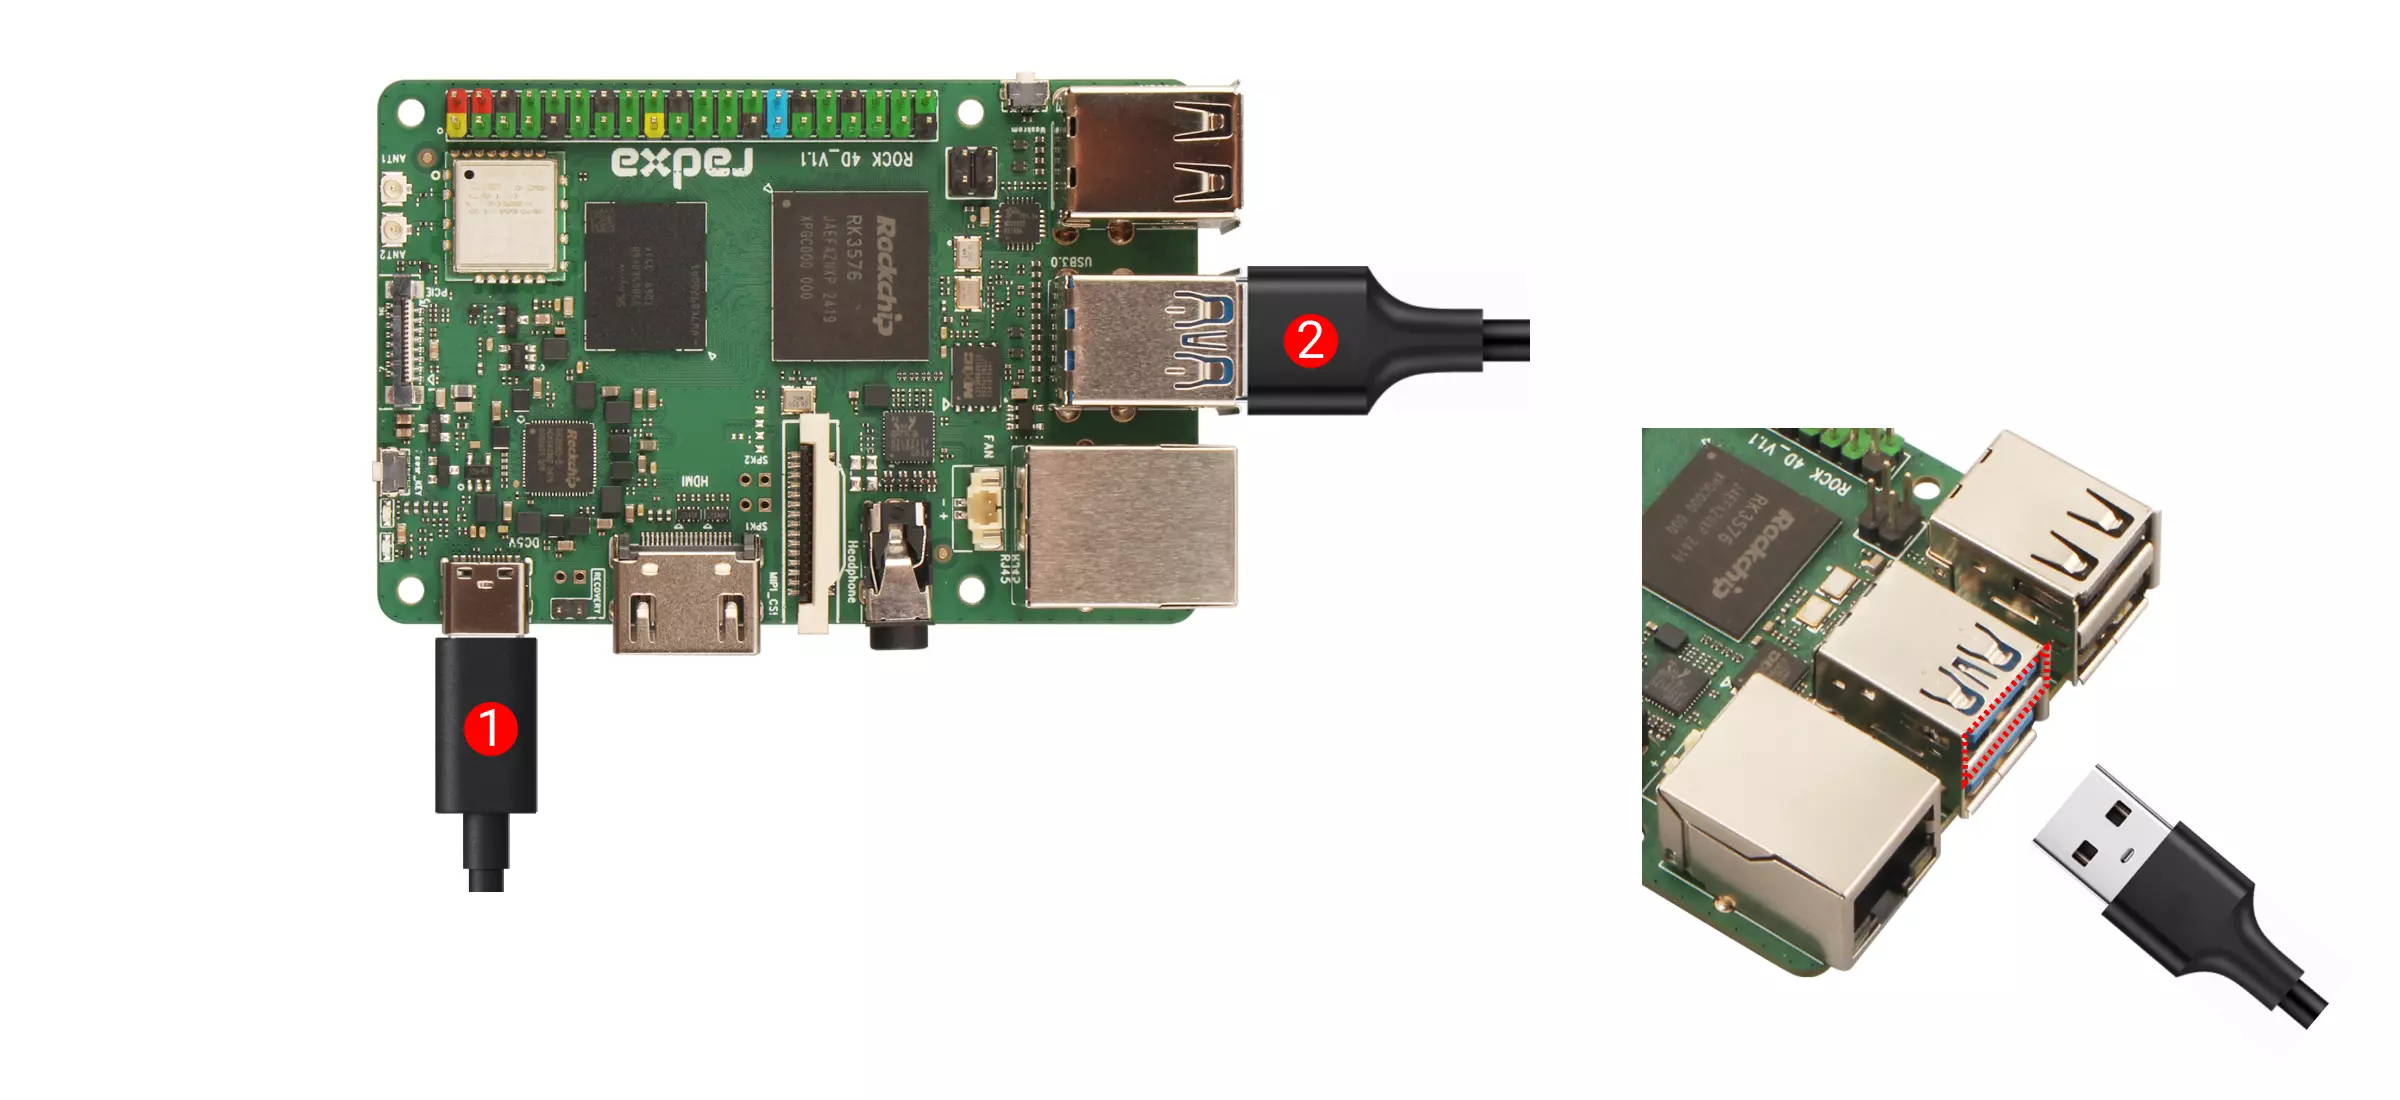
Download SDK Platform-Tools
Official download page: Android SDK Platform-Tools
Download and extract the appropriate SDK Platform-Tools package for your operating system.
Using SDK Platform-Tools
We primarily use the ADB tool from the SDK Platform-Tools.
Open a terminal, navigate to the extracted platform-tools directory, and use the ./adb <command> command to run ADB tools.
Check Version Information
Use the ./adb version command to check the ADB tool version.
./adb version
A successful run will display the ADB tool version information, similar to the following:
Android Debug Bridge version 1.0.41
Version 36.0.0-13206524
Enable Debugging Features
Android systems have USB debugging enabled by default. Wireless ADB debugging is supported from Android 11 onwards.
Wired Connection: You need to enable USB debugging in the board's Android system.
Wireless Connection: You need to enable wireless debugging in the board's Android system.
Wired Connection
Connect the board to your computer using a USB cable for wired debugging.
Wireless Connection
Power the board using a power adapter. The board's WiFi and your computer need to be connected to the same network to ensure they are on the same local network.
Enabling Debugging Features
You need to enable Developer Mode on the board's Android system to check if USB and wireless debugging are enabled.
Steps to enable USB and wireless debugging:
- Navigate to
Settings→About tableton the board's Android system. - Tap
Build numberseven times to enable Developer Mode. - Go to
Settings→System→Developer optionson the board's Android system. - Check the
USB debuggingandWireless debuggingoptions. - Click on
Wireless debuggingto view theIP address & Portinformation, which is required for wireless debugging.
View Device List
Use the ./adb devices command to view the list of connected devices.
./adb devices
A successful run will display a list of devices, similar to the following:
List of devices attached
7c0016117200887238d	device
Connect to Android Device
- Wired Connection
- Wireless Connection
In the platform-tools directory, use the ./adb shell command to enter the Android device's terminal shell.
./adb shell
Upon successful connection, the Android device's terminal shell will be displayed, similar to the following:
radxa-<sbc_model>:/ $
In the platform-tools directory, use the ./adb connect <device_ip> command to connect to the Android device.
./adb connect <device_ip:port>

# Example

./adb connect 192.168.31.201:43167
A successful connection will display a message similar to:
already connected to 192.168.31.201:43167
After a successful connection, use the ./adb shell command to enter the Android device's terminal shell.
./adb shell
Upon successful entry, the Android device's terminal shell will be displayed, similar to:
<sbc_model>:/ $